Trading Journal
The Tapeboard Journal is a six-tab trade log - Dashboard, Trade Log, Reports, Calendar, Playbooks, AI Analysis - built on one unified, account-size-agnostic stats engine. It computes a 0-100 Tape Score with an A-F grade, scores rule-defined Playbooks for machine-checkable adherence, auto-logs simulator trades, turns any trade into a privacy-safe share link, and ships eleven analytics reports with free broker CSV import across 10 brokers (plus a generic column-mapping wizard for any other broker and for options trades), a post-import stats summary, and live broker sync. This guide assumes zero trading experience and explains every term inline.
The Journal is where the loop closes. Every trade you take, every setup you tag, every R you log, every screenshot you save lands in one place, scored by a single stats engine that doesn't care how big your account is - a $2,000 account and a $2M account are graded on the same risk-normalized curve. The same engine powers the Dashboard tab, the Reports, the Tape Score, and the per-Playbook breakdowns, so no two numbers in your journal can ever disagree with each other.


Your trades are saved to your Tapeboard account (the server-side store) with an instant copy cached in your browser - so the page paints fast, your history survives a cleared browser, and your journal follows you to another device. R, in plain words, is how many times you made back the money you risked: risk $1 per share with your stop, make $3, that trade is a 3R win. R lets a 100-share trader and a 10,000-share trader compare trades on equal footing. (Full write-up: R-multiple methodology.)
Open it with ⌘7, JOURNAL in the sidebar, or /journal/:tab (e.g. /journal/log). The Journal is free to open: Free accounts get the Trade Log showing up to 20 trades a month (your full history stays stored), the Dashboard and the Calendar over a rolling sample of your last 10 trades, plus CSV import from any of 10 brokers. Every tab is visible on every tier - the Pro ones (Reports, Playbooks, AI Analysis) show their content with an upgrade pitch inside until you're on Pro. The tier table has the exact split.
If you're brand new: Getting started covers the account basics, the Simulator guide shows you how to practice with fake money, and this guide assumes you have never kept a trading journal before.
Your first three minutes
- Open
/journal. You land on the Trade Log (Free and Pro) or the Dashboard (Terminal) - six tabs across the top either way. - Log one trade. Click ADD TRADE. Fill in the essentials: ticker (
AAPL), long or short, entry and exit prices, shares, the date. Add a stop loss if you used one - that's what powers the R math. Press save. - Tag it. Still on the trade, pick a setup from the list, add a free-form tag or two (
pre-market,news-catalyst), and grade your own executionA+throughF- grade the *process*, not the outcome. - Look at what you just made. The row shows P&L, R, and your grade. Click the row to expand it: the Journal auto-renders the intraday chart with your entry and exit marked, with room for screenshots and an AI review.
- Practice more for free. Close a trade in the simulator and it auto-logs here instantly - the fastest way to build a graded record before risking real money.

The six tabs
One engine, six views. The header's period selector (Week / Month / Quarter / Year / All) re-scopes every tab at once, and REAL / SIM / ALL filters live-vs-practice trades.
| Tab | Path | What it holds | Tier |
|---|---|---|---|
| Dashboard | /journal/dashboard | Tape Score, KPI strip, equity curve, auto-insights, day/hour breakdowns | Free (10-trade sample) |
| Trade Log | /journal/log | Add/edit trades, setup/tag/grade, per-trade chart + AI review + share + screenshots | Free |
| Reports | /journal/reports | Eleven analytics reports sliced every way that matters | Pro |
| Calendar | /journal/calendar/:ym | Monthly P&L heatmap, click a day to drill into it | Free (10-trade sample) |
| Playbooks | /journal/playbooks | Rule-defined setups scored for adherence | Pro |
| AI Analysis | /journal/ai | Pattern recognition plus weekly and monthly summaries | Pro |
Dashboard
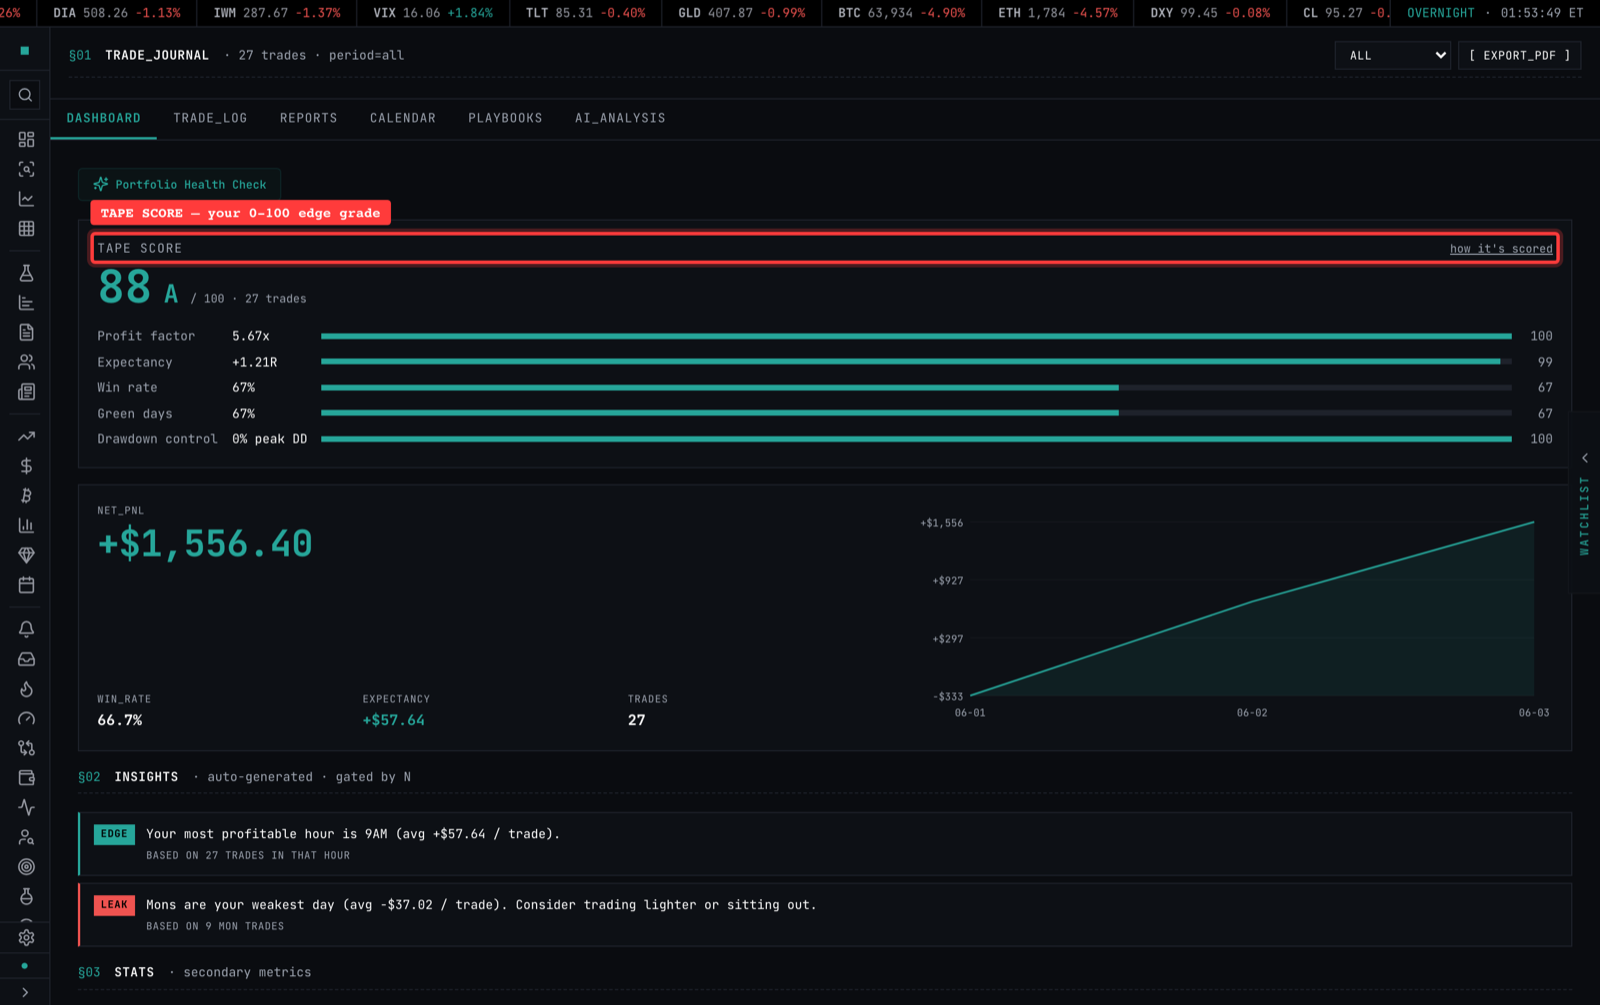
The headline view. Your Tape Score sits up top - a single 0-100 grade with an A-F letter that answers "how good is my process, really?" in one number, comparable across accounts of any size. The score is built from five components, each normalized to 0-100 and weighted:
| Component | Weight | Plain words | Scoring |
|---|---|---|---|
| Profit factor | 25% | Gross wins divided by gross losses - the bang per buck of your wins | PF 1 scores about 33, PF 3 caps at 100; no losses = 100 |
| Expectancy | 25% | Your average R per trade - what one trade typically pays | Scored on R, so size-agnostic |
| Win rate | 20% | Share of closed trades that were green | Direct |
| Consistency | 15% | Percent green days - how steady you are, not how hot | Direct |
| Drawdown control | 15% | How deep your worst peak-to-valley dip went | Shallower is better |
The letter maps A at 85+, B at 70+, C at 55+, D at 40+, F below - and the composite needs 30 or more closed real trades before it shows (10 in a pure-simulator view), because a grade built from three trades is astrology, not statistics. Free sees the headline number and letter; the per-driver breakdown is Pro.
Under the score: the KPI hero strip (Net P&L, win rate, profit factor), the equity curve with the drawdown window shaded (unlocks at 3 closed trading days), auto-insights - a strip of plain-English findings tagged EDGE (green), LEAK (red), or NOTE (yellow), like "You hold losers 2.3x longer than winners" or "Tuesdays are your weakest day," each with the basis it was computed from and gated by sample size so tiny samples don't spout nonsense - and P&L by day-of-week and hour bar charts, which unlock at 10 trades for the same reason.

Trade Log
The row-level log. Each row shows ticker, direction, P&L, R, and grade; click to expand a trade into its full detail.
Adding or editing a trade captures:
| Field | Notes |
|---|---|
| Ticker | e.g. AAPL |
| Entry / Exit Price | the fills |
| Shares | position size |
| Date | trade date |
| Direction | long / short |
| Stop Loss (optional) | drives R-multiple and Playbook risk checks |
| Commissions | netted out of P&L |
| Entry / Exit Time | drives hold-time and Playbook time-window checks |
| Setups | structured selection from your setup list |
| Playbook | optional assignment that drives adherence scoring |
| Tags | free-form labels (e.g. pre-market, news-catalyst) |
| Setup Grade | self-graded execution quality: A+, A, B, C, F |
| Notes | free text - what you saw, what you'd do differently |
| Screenshots | attached on entry, displayed in the row-expand |
On mobile, a + quick-trade button (bottom-right) opens the same form.
The expanded trade view stacks, for one trade:
- an auto-rendered intraday chart with your entry and exit marked,
- an on-demand AI review - a pattern read of that single trade,
- a SHARE button (privacy-safe public link, see below),
- and your attached screenshots.
When you open the log filtered to a specific date (via the Calendar), a Daily Notes panel renders above the rows for that day.

Importing real fills:
- CSV import (Free, moved off Pro 2026-07-04): drop a broker export and the parser auto-detects the format across all 10 supported brokers - Fidelity, Schwab, Webull, Robinhood, IBKR, Tradervue, DAS, Sterling, tastytrade, and TradeStation. Fills are paired into round-trip trades automatically.
- Any other broker: an export the parser doesn't recognize opens a column-mapping wizard instead of failing - point Tapeboard's canonical fields (Symbol, Side, Quantity, Price, Date, plus optional Time and Commission) at your file's own columns, using a live preview of your first rows and a running "N trades ready to import" count. Options trades import through the same wizard: map optional Option Type / Strike / Expiry columns, or leave them blank and Tapeboard auto-detects call/put, strike, and expiry straight from an OCC-format symbol in your Symbol column. (IBKR Flex guide.)
- Live broker sync: connect a supported brokerage account and filled orders flow in automatically; manual, imported, and simulator entries coexist, and an entry-fingerprint de-dup prevents re-imports from double-counting.
- Export: CSV export of the visible set; bulk CSV/JSON export is a Terminal feature.

After an import lands, a summary screen shows what changed in that batch: trades added, open positions closed, duplicates skipped, and - once at least one trade in the batch is closed - Net P&L, Win rate, Profit factor, Best trade, Worst trade, and Fees paid, computed over just the rows you brought in so the numbers are easy to sanity-check against the file itself. Free accounts see a reminder that the free plan shows 20 trades per month and samples 10 for analytics - Pro opens the full imported history and all eleven Reports.

The sim → journal bridge
The free paper-trading simulator is wired straight into the Journal. When you close a trade in the simulator, it is auto-logged into the Journal - no CSV, no import, no copy-paste. That closes the practice-to-review loop: rehearse a setup in the sim, and the moment you exit, the trade is sitting in your Trade Log waiting to be tagged, graded, and folded into your Tape Score. Because both surfaces run the same engine, a simulated trade is scored exactly like a live one - it's the fastest way to build a graded track record before you risk real money.
Reports
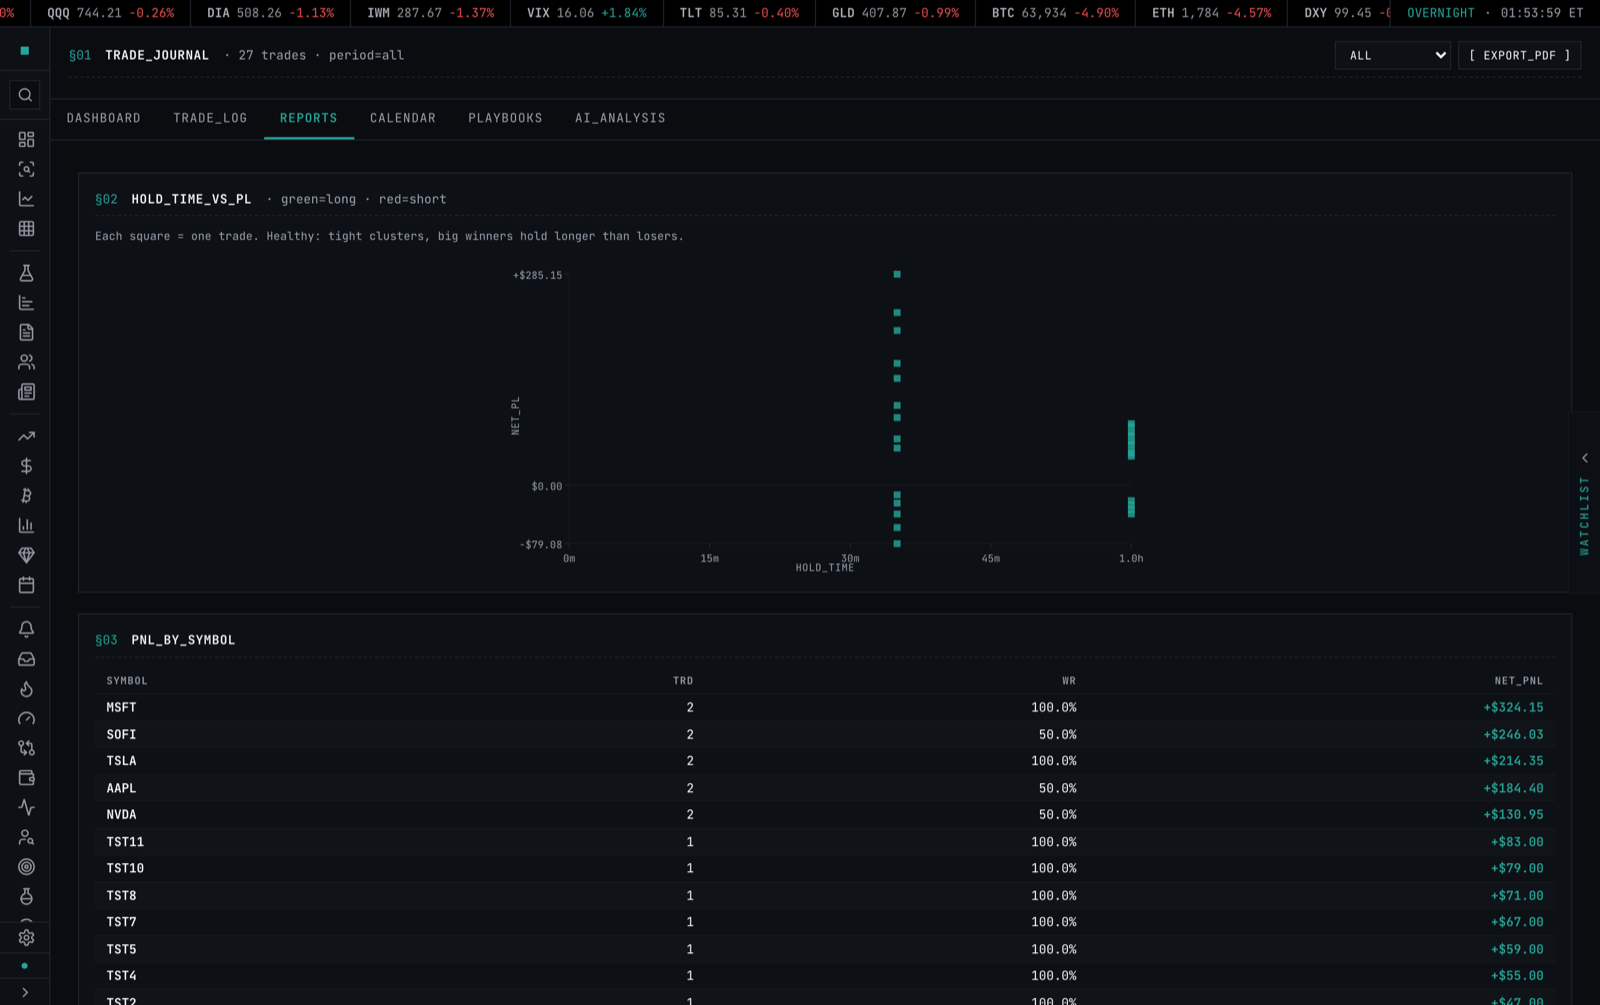
Eleven analytics reports, all off the same engine, all re-scoped by the period selector - plus a twelfth (RISK) that appears once you have 10 or more trades, and two more (CALLS/PUTS, DTE) for options traders. The ones most people fix their leaks with first:
- Trade Efficiency - exit quality: how much of each winner you captured.
- Mistake Cost - what your logged mistakes actually cost in dollars, tied to your daily discipline entries.
- MFE/MAE - max favorable vs max adverse excursion: how much the trade went your way before you exited (money left on the table) and how far it went against you before coming back.
Everything slices by setup, tag, symbol, hour, day-of-week, grade, and direction. Pro tab - Free sees the upgrade pitch inside it.
Calendar
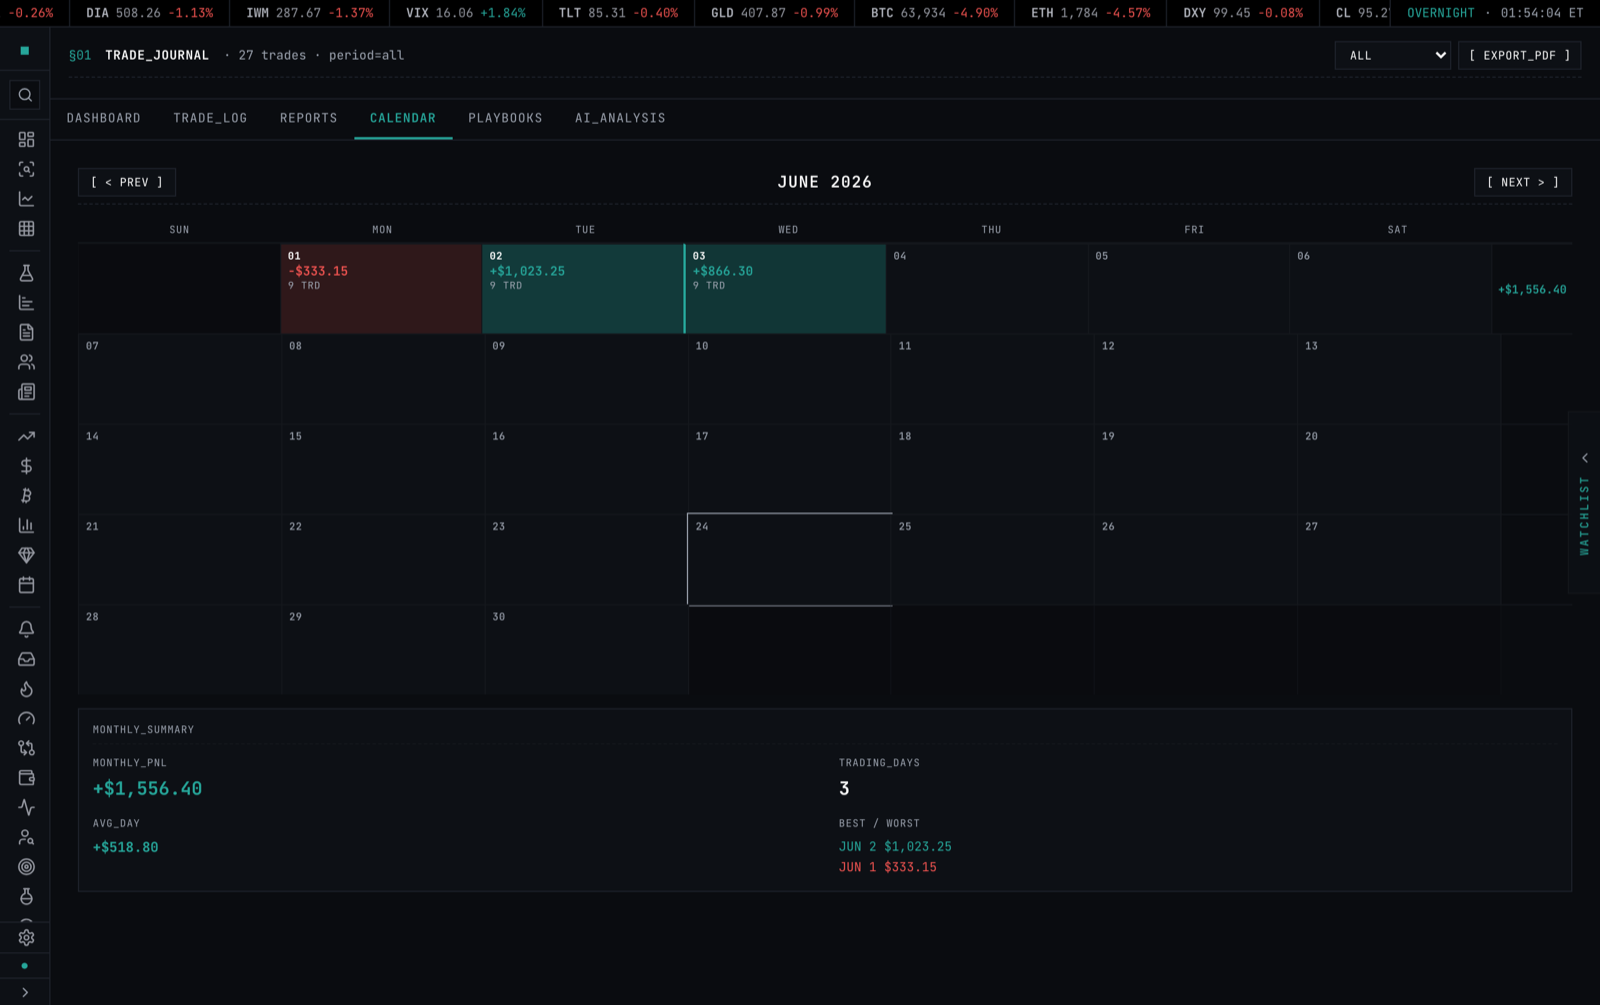
A monthly P&L heatmap: green days, red days, one glance. Click a day and the Trade Log opens filtered to that session - which is also what surfaces the Daily Notes panel for it. Navigate months with /journal/calendar/2026-06. A Free account sees the same calendar over its rolling 10-trade sample.
Playbooks
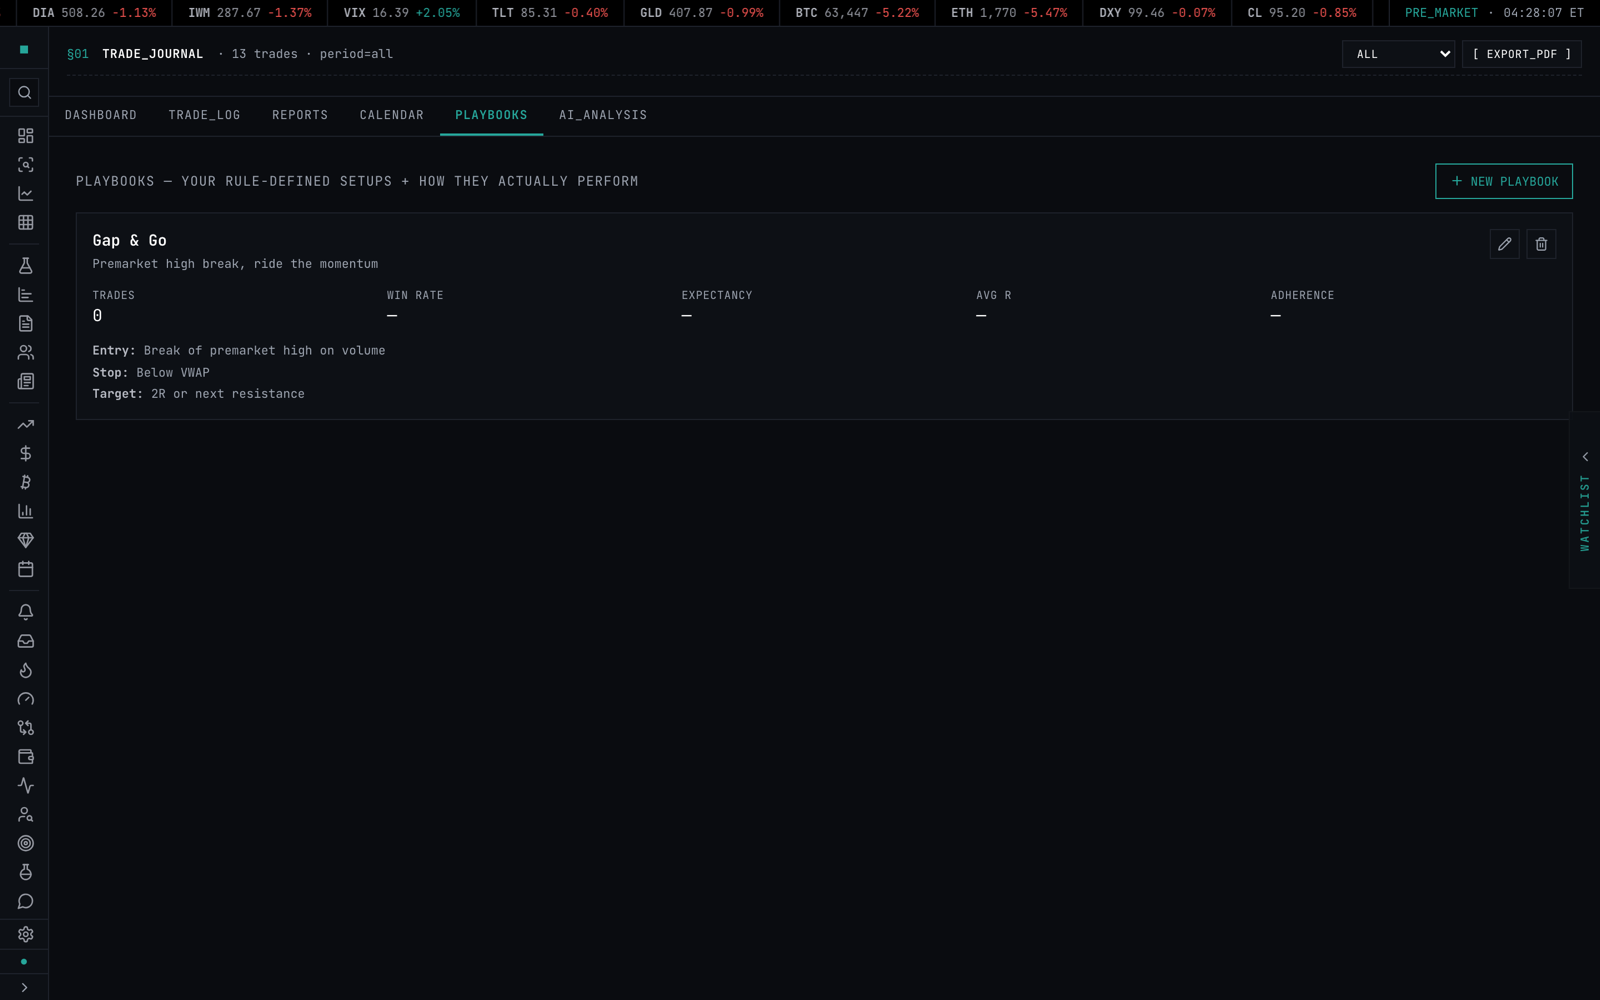
A Playbook is a setup with rules - the difference between "I trade breakouts" and "I buy the break of pre-market highs on names up 4%+, stop under VWAP, targeting 2R, between 9:30 and 10:30 only." Define the entry rule, the stop rule, the target rule, a time window, whether the stop is required, and a target R:R. Assign trades to a Playbook and the Journal scores your adherence - machine-checkable, outcome-blind: did the trade enter inside the time window, did it carry a stop when the Playbook requires one. The rollup shows per-playbook win rate, expectancy, average R, trade count, and average adherence, so you can tell whether your edge lives in the setup or leaks out through rule-breaking. Pro tab.

AI Analysis
Pattern Recognition (needs 10+ closed trades) scans your closed set for recurring structure - the times of day, setups, or behaviors that cluster your best and worst trades - plus Weekly and Monthly summaries in plain English. The per-trade AI review lives on each trade row instead; this tab is the cross-trade view. Pro tab.

Share a trade
Any trade can become a privacy-safe public link at tapeboard.com/s/:id that unfurls with a rich preview card when pasted into chat or social - a deep-link back *into* Tapeboard, not a social-feed post. The card shows symbol, R, %, and the setup; by default P&L and position size are hidden. Revealing P&L and revealing size are two separate Pro toggles, per link; generating the link itself is free on any tier. Share the read without handing over your size.

The daily journal
Beyond the trade rows, log a daily entry (the Daily Notes panel, opened when you filter the log to a date):
- Mood - a quick mood selection for the session
- Discipline - a 1-10 score of how well you followed your process
- Market context - how the tape was (VIX, sectors, breadth, catalysts)
- Mistakes - tag the session's mistakes from a chip list
- Lessons learned - free text
The daily entries are what the Mistake Cost report and the AI coach read against, so the more honestly you log them, the sharper the diagnosis.
How to use it
The loop, end to end:
- After each session - log the fills (or let the simulator auto-log them), tag the setup, assign a Playbook, grade your execution, and write the daily entry: mood, discipline 1-10, mistakes, lessons.
- Weekly - open Reports, read the Mistake Cost and Trade Efficiency reports, prune the leaks. Check the hour and day-of-week charts against your schedule.
- Monthly - did the Tape Score letter move? Open the per-driver breakdown (Pro) and find which of the five components is dragging - that's next month's homework.
Plus the fast paths:
- Use the header period selector (Week / Month / Quarter / Year / All) to re-scope every tab at once, then
[ EXPORT_PDF ]for a print-ready report. - Run the Dashboard's Portfolio Health check on the symbols you carry.
- Turn a standout trade into a share link - free to generate, size hidden by default.
Tiering summary
| What | Free | Pro ($39/mo) | Terminal ($79/mo) |
|---|---|---|---|
| Trade Log + CSV import (10 brokers) | Yes, full history kept, 20 trades per month shown | Yes, unlimited | Yes, unlimited |
| Dashboard + Calendar | Yes (10-trade sample) | Yes, unlimited history | Yes |
| Tape Score | Headline number + letter | Full per-driver breakdown | Full |
| Reports, Playbooks, AI Analysis | Tabs visible, upgrade pitch inside | Fully unlocked | Fully unlocked |
| Share links | Generate free; P&L + size hidden | + both reveal toggles | + both reveal toggles |
| Broker live sync | - | Yes | Yes |
| Bulk CSV/JSON export | - | - | Yes |
(Pricing has the full product table. The 7-day Pro trial counts.)
Limits
- Free's 10-trade sample applies to the Dashboard and Calendar views, not to storage - your full imported and logged history is kept and scores for real the moment you're on Pro.
- The Tape Score composite needs ≥30 closed real trades (≥10 in a pure-simulator view); the equity curve unlocks at 3 closed trading days; the day/hour charts unlock at 10 trades.
- Auto-insights are sample-gated (most need ≥5 trades in the bucket) - small-sample tabs stay quiet rather than guessing.
- Two of the three desktop watchlist starter cards (see the Watchlist guide) are illustrative; journal imports are the opposite - every format detection is real, and anything unrecognized opens the mapping wizard.
- Methodology deep-dives live outside the app: /methodology/tape-score for the five-component formula and weights, /methodology/r-multiple for R-multiple.
Troubleshooting
What is the Tape Score, exactly? A single 0-100 grade with an A-F letter scoring your process over five risk-normalized components: profit factor (25%), expectancy in R (25%), win rate (20%), green-day consistency (15%), and drawdown control (15%). A at 85+, B at 70+, C at 55+, D at 40+, F below. Risk-normalized means account-size agnostic - a $2K account and a $2M account grade on the same curve. It needs 30+ closed real trades (10+ in a pure-sim view); Free sees the headline, Pro the per-driver breakdown. Full formula published at /methodology/tape-score.
My grade feels harsh - why? The score is a process grade, not a P&L report. Two wins can both be A-grades if the process was clean; a lucky win you didn't plan is F-grade *process*. Check the per-driver breakdown (Pro) for which component is dragging - drawdown control and consistency are the usual culprits after a hot streak.
How does the sim-to-journal bridge work? Close a trade in the simulator and it's auto-logged into the Trade Log - no CSV, no import. Both surfaces run the same engine, so a simulated trade is tagged, graded, and scored exactly like a live one.
What is adherence? How faithfully a trade followed its assigned Playbook, scored from objective, machine-checkable rules only - no outcome, no subjectivity. It checks whether the trade entered inside the Playbook's time window and whether it carried a stop when the Playbook requires one, then reports the percentage of checks passed. A Playbook with neither rule shows adherence as not applicable.
Are share links private? By design. The unfurled card shows symbol, R, %, and setup - P&L and position size are hidden by default. Revealing each is a separate Pro toggle per link; generating the link is free. Nobody sees your size unless you decide they do.
My imported trades didn't all show up. They're there - the free log shows your 20 most recent trades each month (the banner over the log says so) and the analytics run on a 10-trade sample, while the full history is stored and fully scores on Pro. Nothing was dropped.
I don't see a Tape Score yet. You need 30+ closed real trades (10+ pure-sim) for the composite. Below that, a grade would be astrology, not statistics. Log trades - or close some in the simulator - and it appears.
Related
Every guide below pairs with a one-click surface - guide for the *how*, link for the *doing*:
- Simulator → /simulator (Simulator guide) - practice, and the bridge auto-logs your closes into this Journal
- Trade Journal overview → /trade-journal · Tradervue alternative → /compare/tradervue-alternative
- Tape Score methodology → /methodology/tape-score · R-multiple methodology → /methodology/r-multiple
- Scanner → /scanner (Scanner guide) - find the setups worth grading · Charts → /charts (Charts guide)
- Watchlist · Alerts
- Pricing → /pricing · All guides