Market Breadth
Market Breadth reads the advance-decline split, the up/down volume split, and the 52-week new highs and new lows across a ~100-name large-cap universe — a session-level pulse for whether the tape is broadly green or carried by a few names.
Market Breadth answers one question: is the rally real, or is one mega-cap dragging the index? It batches quotes across a ~100-ticker large-cap universe (the same set the Heatmap uses), counts advancers vs. decliners, sums up-volume vs. down-volume, flags names at new 52-week extremes, and renders a single bullish/neutral/bearish read at the top.
What it is
A server-aggregated breadth panel. It batch-quotes the same ~100-name large-cap universe the Heatmap uses, counts advancers (change > 0), decliners (change < 0), and unchanged (change == 0), accumulates volume into up/down buckets, and flags any name trading within 0.25% of its 52-week high or low. The whole rollup is cached so the panel renders instantly during a session.
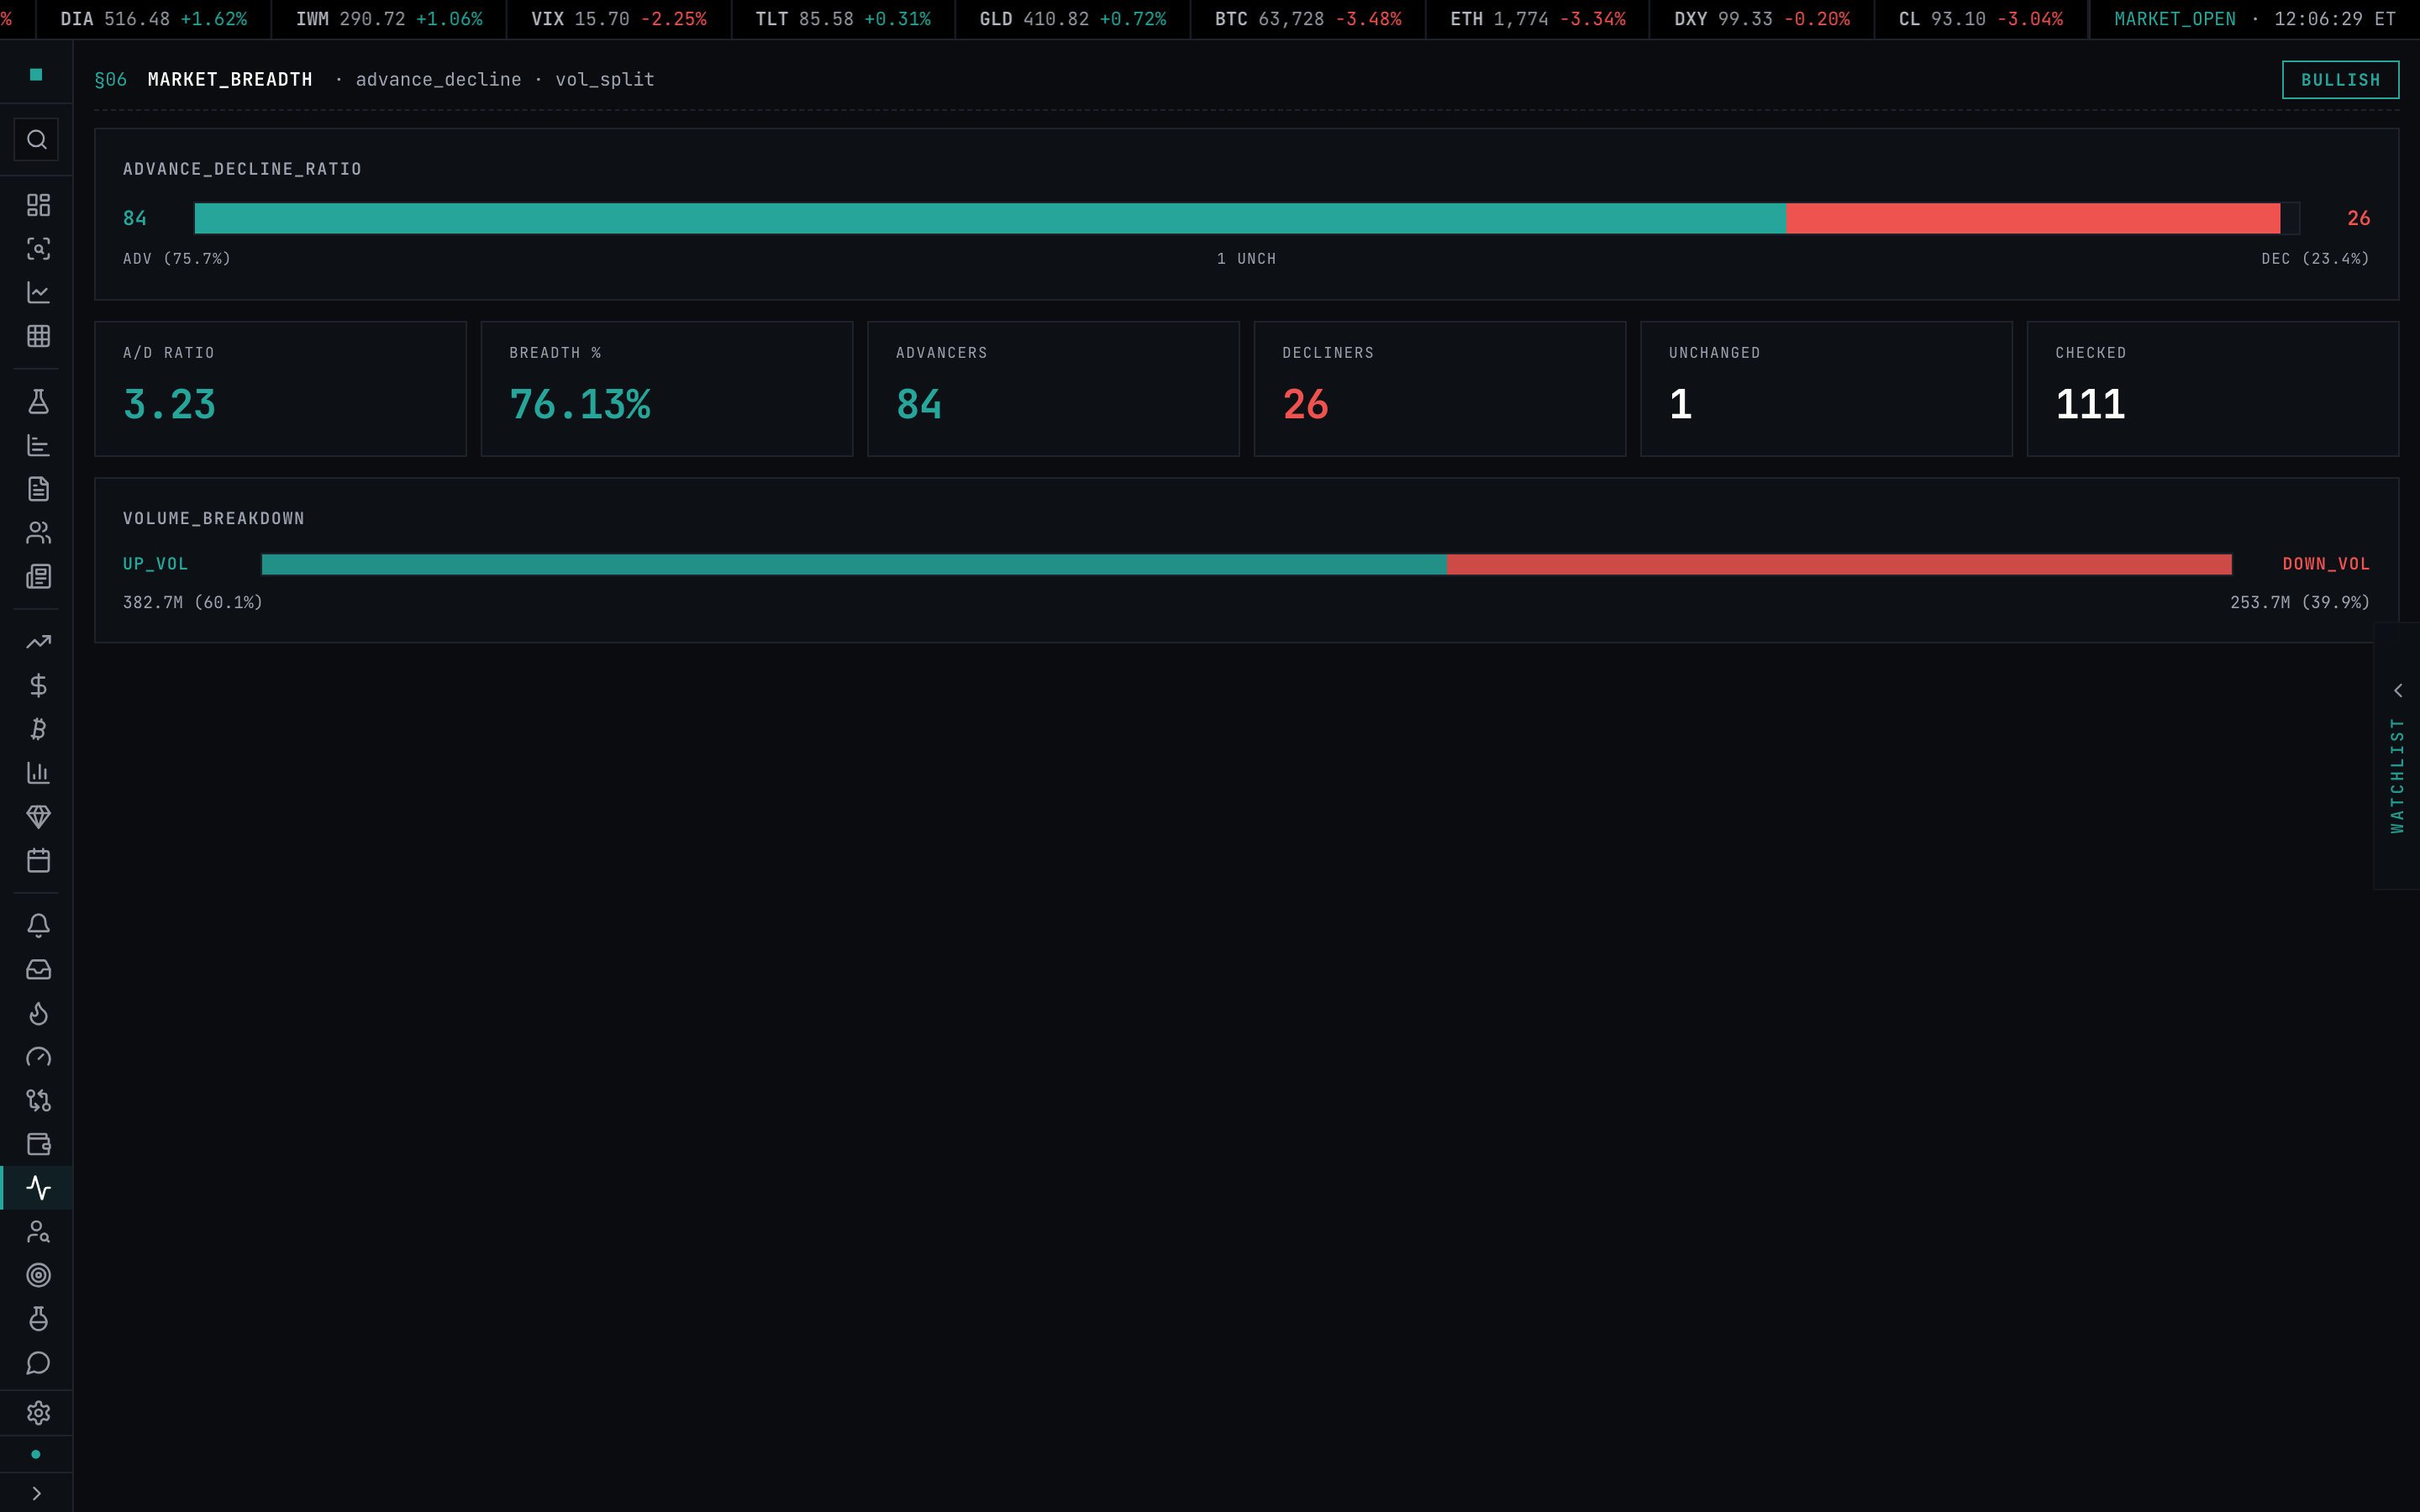
The breadth percentage is (advancers + unchanged × 0.5) / total × 100. The sentiment chip in the header maps that: ≥ 65 → BULLISH (green), 45–64 → NEUTRAL (yellow), < 45 → BEARISH (red). The A/D ratio is advancers / decliners (or advancers if no decliners), rounded to two decimals.
When to use it
At the open to read the tone of the session — a 70% breadth print with QQQ flat means small-caps are leading, even if the headline index doesn't show it. Mid-session to confirm or fade an index move — SPY +0.4% with breadth at 38% is a five-mega-cap rally and historically reverses. At the close to log a regime snapshot for the journal — bullish-breadth-on-down-day or bearish-breadth-on-up-day are both flags worth a note.
Open it
- Path:
/breadth - Shortcut: none — accessible from the
§MARKETSgroup in the sidebar - Tier-gate: Free — the entire panel is unlocked
How to use it
- Open
/breadth. The panel batch-quotes the universe and renders within a couple of seconds. The sentiment chip in the header is the one-glance read. - Read the A/D bar — green segment is advancers, red is decliners. Width proportional to the count. The numbers on each side and the percent split sit below the bar.
- Scan the stat grid:
A/D RATIO,BREADTH %,ADVANCERS,DECLINERS,UNCHANGED,CHECKED. TheCHECKEDcount tells you how many names in the universe returned quotes — if it's well under 100, some quotes failed to load. - Read the volume split — the up/down volume bar shows whether buying volume is concentrated or distributed. A 75% up-volume reading on a 60% advancer count means buyers are pressing the green names hard; a 55% up-volume reading on a 70% advancer count means the green names are drifting up on light tape.
- The panel does not auto-refresh — refresh the browser tab when you want a fresh read. The cache window is short enough that you'll get session-fresh numbers any time you reload.
Fields
| Stat | What it is |
|---|---|
ADVANCERS | Count of universe symbols with positive netChange for the session |
DECLINERS | Count with negative netChange |
UNCHANGED | Count at exactly zero change |
A/D RATIO | advancers / decliners, two decimals. > 1.00 means more up than down |
BREADTH % | (advancers + unchanged × 0.5) / total × 100 — the headline read |
CHECKED | Total symbols that returned a usable quote — a quick health check on the read |
UP_VOL | Cumulative session volume on names with positive change |
DOWN_VOL | Cumulative session volume on names with negative change |
NEW_HIGHS (server field) | Count trading within 0.25% of their stored 52-week high |
NEW_LOWS (server field) | Count trading within 0.25% of their stored 52-week low |
| Sentiment chip | BULLISH ≥ 65%, NEUTRAL 45–64%, BEARISH < 45% |
The server response also includes above_50dma and above_200dma fields, but the current implementation returns 0 for both — those metrics are reserved for a future expansion and the UI does not surface them today.
Limits
- Universe: ~100 large-cap US equities, the same set the Heatmap uses. Does not survey the full Russell 3000 — this is a directional read, not an NYSE-wide A/D line
- New-high/new-low flags depend on the 52-week high and low values being current; some names lag by a session
- McClellan Oscillator, NYSE NH-NL, % above 50DMA, % above 200DMA, and equal-weight vs. cap-weight comparisons are not currently surfaced in the UI — the values are placeholders reserved for a future expansion
- Refresh cadence: manual. The cache window is short, so a hard refresh gets you a fresh-ish read within seconds
- Volume tallies are session cumulative — useful for a directional skew, not a precise dollar volume figure
- The 0.25% proximity band for new-high/new-low is intentional — strict equality would miss most session prints; widening it would dilute the signal
- When the market-data feed is wholly unavailable, the UI surfaces a dedicated
DATA_UNAVAILABLEstate
Troubleshooting
CHECKED shows ~60 instead of ~100. Some quotes failed to return — usually a partial timeout. The breadth math is still valid for the names that came back, but the sentiment chip may swing harder than usual. Refresh in 30 seconds for a fuller read.
Sentiment chip says BEARISH but the indices are green. Mega-cap concentration. Five names (the usual suspects) carry SPY/QQQ on plenty of sessions where the broader tape is red. That divergence is the point of a breadth panel — trust it.
§ERR / BREADTH · feed unavailable. The market-data feed failed for the whole batch. Wait a moment and refresh — a clean feed outage shows the dedicated DATA_UNAVAILABLE state instead.
Volume bar shows 50/50 even though the count is skewed 70/30. The thin-volume side has fewer names but higher cumulative volume — one mega-cap printing 20M shares on the down side flattens the bar fast. The split is correct; it's telling you positioning is heavy where the count is light.
New-highs and new-lows numbers don't show in the UI even though they're computed. The current panel only surfaces the A/D bar, the six stat cards, and the volume breakdown. The new-high/new-low counts are reserved for a future expansion of the panel — until then, use the Scanner 52w-highs / 52w-lows presets for the full list.
The page loads instantly on every visit. Caching. The breadth aggregation is expensive enough that we cache it hard — refresh the browser tab for a fresh read, and you'll still get sub-second responses until the cache window expires.