Economic dashboard
All the macro data. One terminal.
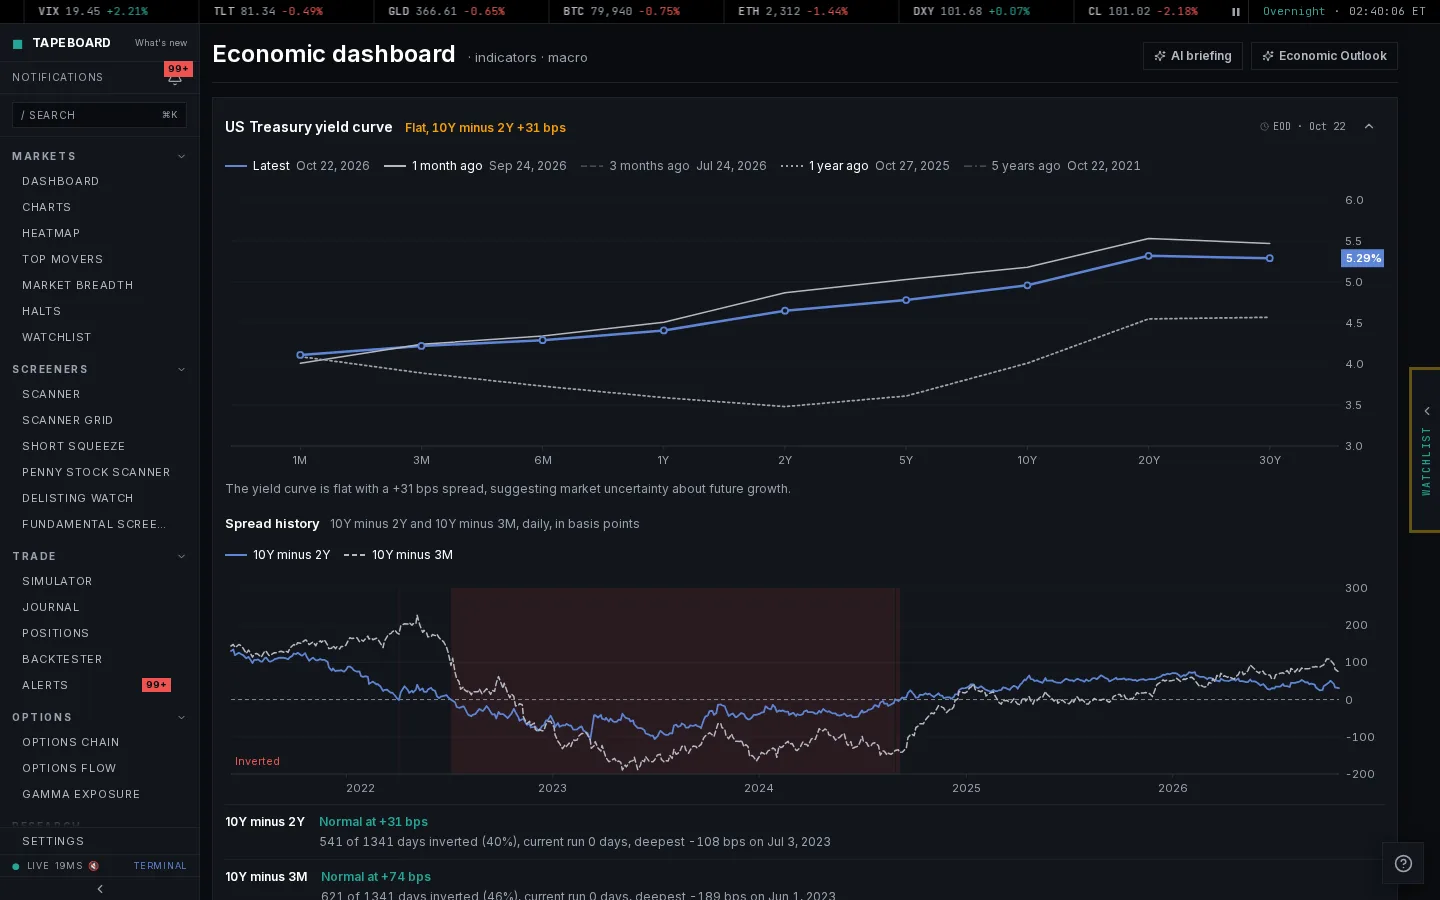
Macro indicators, releases, and calendars in one view: 800K+ series searchable beside the tape.
What you get
CPI, payrolls, yields, money supply, credit spreads: searchable and chartable.
The week’s releases with actual/expected/prior, so the print is never a surprise.
Macro sits next to the scanner and chart workspace, not in another app.
What it does
- Macro indicators: rates, inflation, GDP, employment, housing, liquidity, TIPS
- Interactive yield curve strip across the full maturity ladder
- Economic event calendar with upcoming data releases
- Recession indicator: 10Y-2Y spread, unemployment trend, jobless claims, VIX
- Click any indicator to expand a historical chart (Pro)
- AI-written economic outlook on demand (Pro)
- Free tier: 8 core indicators including Fed Funds, CPI, GDP, unemployment, 10Y, 2Y, mortgage rate, housing starts
Own the tape for $99/mo
Try Pro for $1. One paid plan at $99/mo (or $948/year billed annually) carries every feature this terminal has.
- Top 3 movers live + 1 penny runner
- A starter set of chart indicators + scanner presets
- SEC filings reader (latest 10) · heatmap preview
- 3 price/volume alerts
- Real-time data, every surface
- Every preset · every indicator
- Unlimited alerts · AI research
- Trade journal · paper-trading simulator
- The full AI suite · multi-workspace layouts
- Priority support
An institutional terminal runs about $24,000/yr. Tapeboard is $99/mo, no contract, permanent free tier. The Pro trial is $1 for 14 days.
Questions, answered
Is the economic dashboard free?
Where does the data come from?
Can I chart a series?
Open the terminal. Free.
A live scanner for day traders. Every mover shows its news, SEC filings and dilution flags. Start free, or try Pro ($1 for 14 days).
Try Pro for $1 · 14 days, then $99/mo